Learning Oversight Dashboard
Bring together learning, recommendations and actions from across the review journey, including panel, but also PMRTs, coronial inquiries, criminal investigations and child safeguarding practice reviews, so there is oversight of the learning and impact of the child death review process.
Runs in your browser on your own machine. No installation, no accounts, and no data leaves your organisation.
What it does
Throughout the child death review process, learning, actions and recommendations are identified for many agencies, yet often no single group holds overall oversight. This tool brings it all together in one place and gives governance groups one clear line of sight.
-
01
Learning from every review
- Panel reviews
- Perinatal mortality reviews (PMRT)
- Coronial and criminal investigations
- Child safeguarding practice reviews
All of these are brought together, so oversight does not wait for a case to reach panel.
-
02
Recorded once
One shared recordEach learning point, action and recommendation is held in one place, with its likely impact.
-
03
One clear view
An overview, a summary for each agency, and red, amber and green progress.
-
04
Ready for governance
- Overview dashboard
- Agency summaries
- Progress charts
- Impact evidence
Evidence that learning has led to action, and what difference it has made.
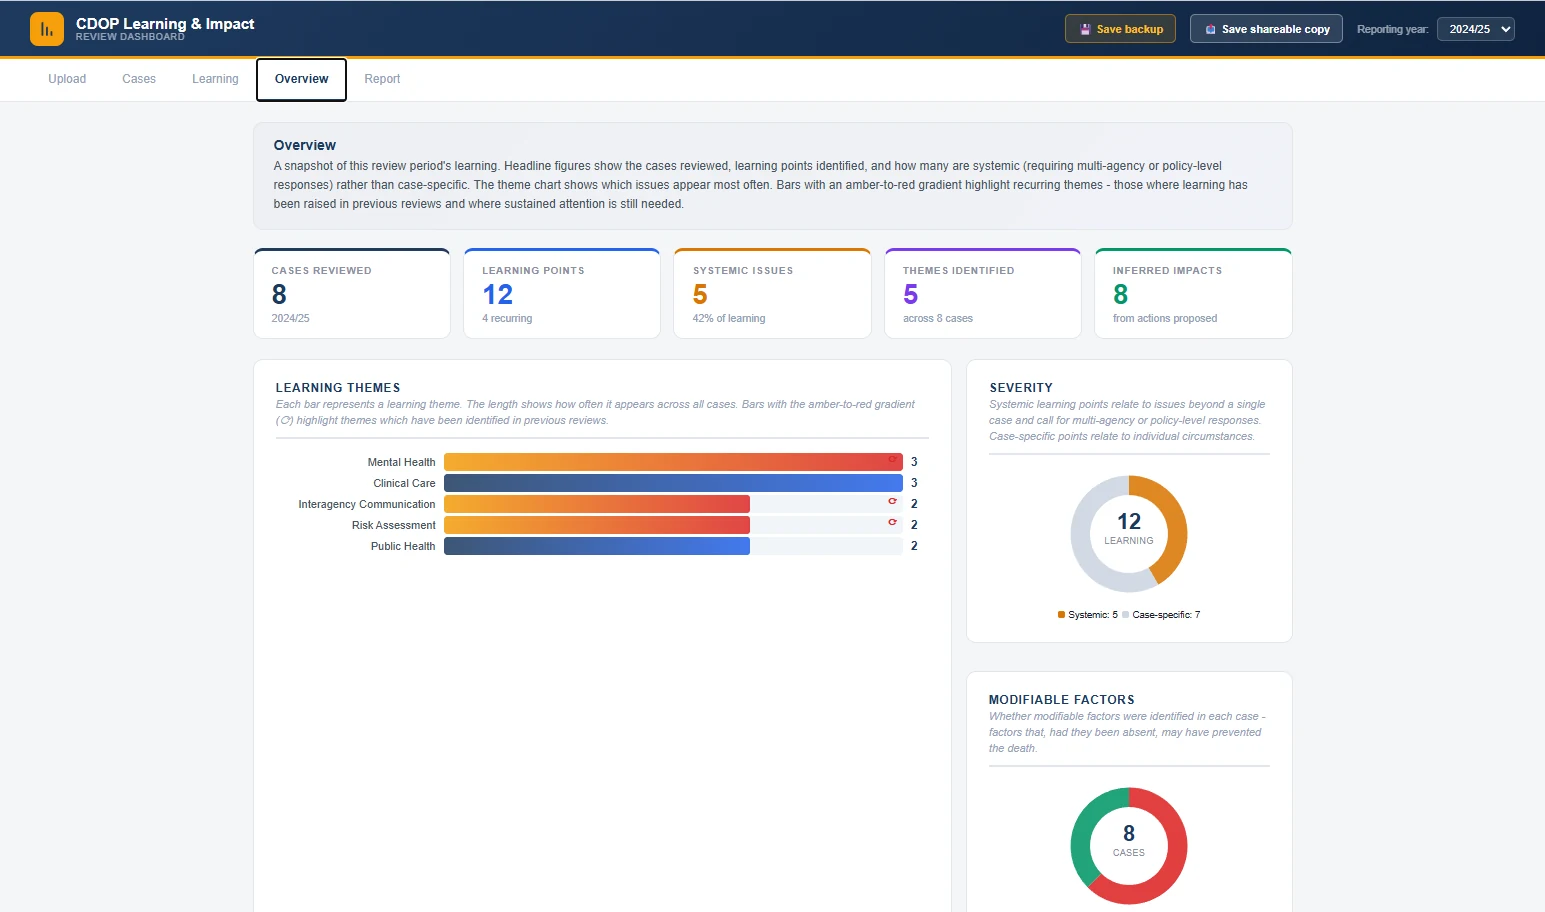
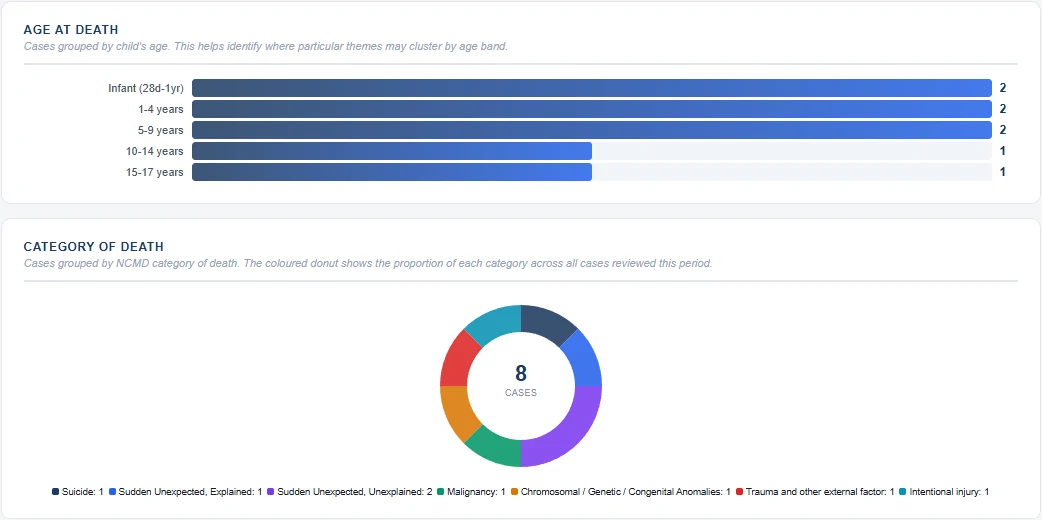
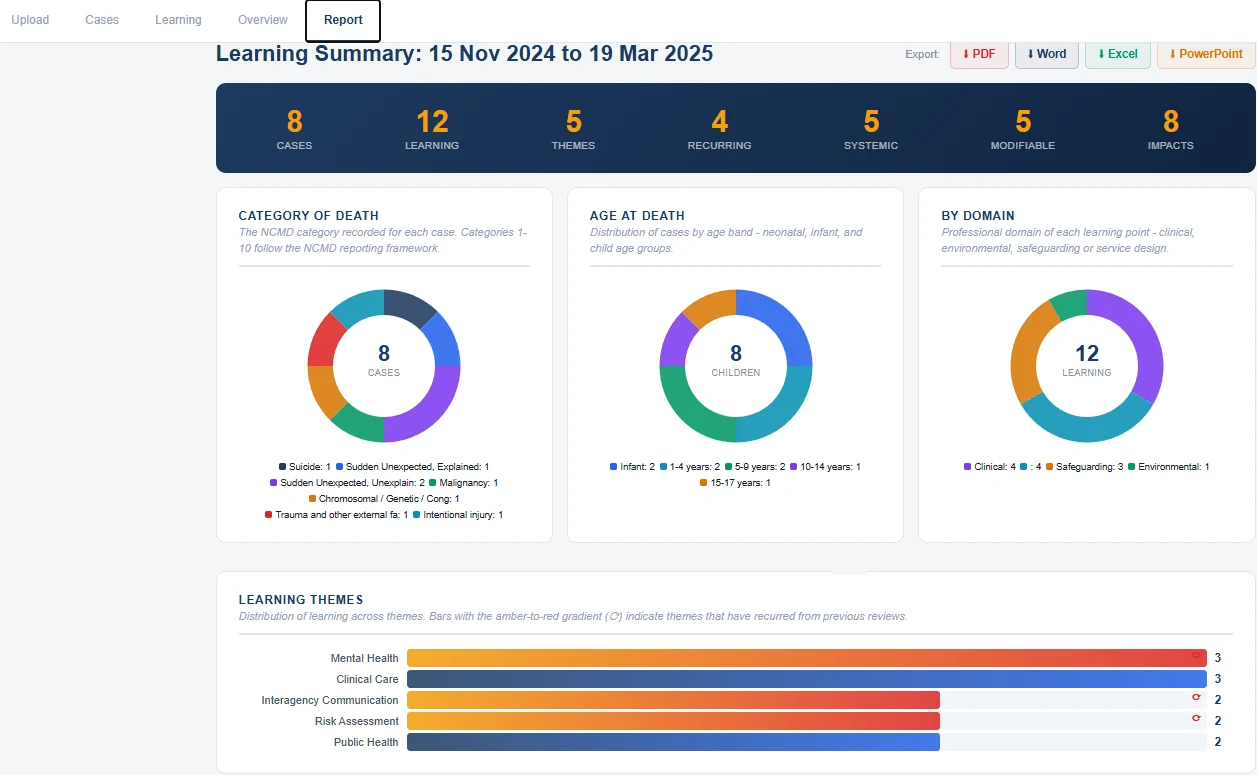
Screens
What the tool actually looks like in use.
Demonstration
A recorded walkthrough, so you can see the tool working before you ask for anything.
Features
- Strips out all learning, actions and recommendations in one place
- Captures potential impacts alongside each item
- Overview dashboard plus agency-by-agency summaries
- RAG-rated progress charts for timely assessment
Who it is for
Multi-agency governance groups and CDR oversight arrangements.
Information governance
The tool is a single file that opens in a standard web browser. It installs nothing, creates no account, and makes no connection to any outside service, including none back to Turning Over. Whatever you load into it is processed on your own machine and stays there.
See it working before you commit
Every enquiry starts with a demonstration using example data, so you and your IG lead can see exactly how the tool behaves.
Other tools
Open Cases Report Tool
See where cases are sitting, what is holding them up, and what needs chasing. Useful preparation for each Business Group meeting.
- Colour-coded dashboard of every open and outstanding case
- Highlights where cases are being held up, and by whom
- Ready-to-share Word, PDF and PowerPoint documents
NCMD Recommendations Tracker
Keep track of national recommendations and record what your partnership has done about each one.
- Partner agencies record their own progress, notes and planned actions
- Administrator dashboard flags overdue and due-soon items
- Print-ready report for CDR oversight
CDOP Report Generator
Turn your panel data into a structured, readable report without rebuilding it by hand each year.
- Links analysis to your CDOP's own local priorities, not just a data dump
- Compares trends across multiple years so patterns are easy to see
- Uses postcode-level deprivation data to help target where support is needed most